Coming up for a year ago now I took part in the inaugural Sync the City event in Norwich, and guess what – it’s happening again!
Last year we undertook the challenge to design, build/develop and deploy our business cotravel in 54 hours. This culminated in a working system (with proper back end, usable APIs, web interface etc), several actual business agreements with local taxi companies, and finally an excellent presentation by Rod.
The event garnered quite a bit of press (in which we got a mention!) and has been the subject of some other reflective blogging by team members. Sadly I can’t take part this year (some nonsense about a PhD I have to finish…), but it got me looking back.
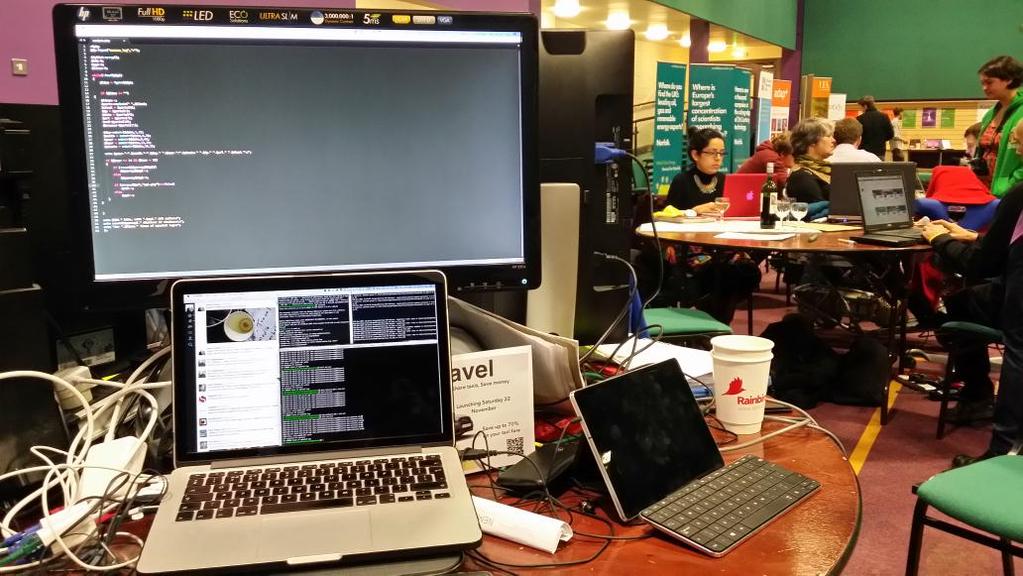
During the two days of (frantic) development we used a git repo on BitBucket to manage our source code between the development machines, test, and live environments. This got me thinking it would be nice to visualise the development process mining the repository, if only I had the tools and computing power. Then I remembered I totally do! Analysing software systems, including from repository logs, is kinda what we do. So, waiting for a long experiment to finish, I realised I could quickly bodge a couple of our tools together and see what I could get.
During the development period (evening of 20th November to evening of 22nd November) there were two developers: David (me), and Adam (not me). So I plotted commits by hour both per developer and in total, from the very first commit at 17:28 on the 20th to the last at 16:46 on the 22nd.
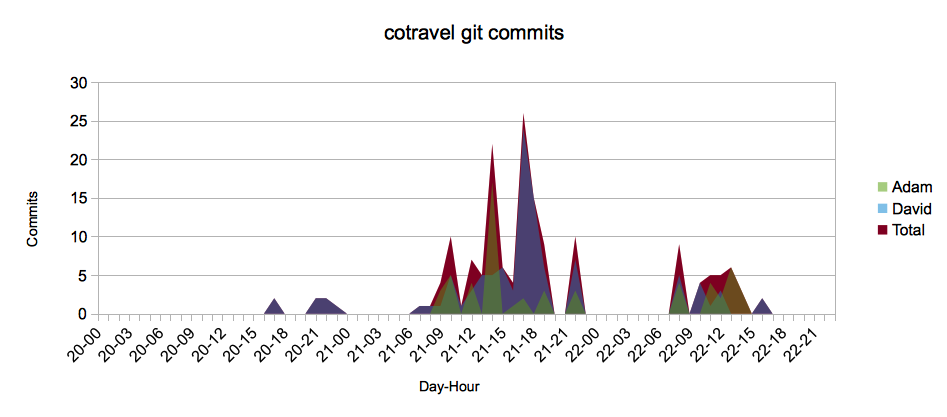
And there we have it, from 0:00 on the 20th to 23:59 on the 22nd. As you can see the main splurge of work (technical term) was on the 21st from 06:00 to 22:00, which is when we built the majority of the functionality. On the 22nd we again got an early start, but nowhere near the commit intensity and it petered off anyway, after go live at 14:00 on the 22nd to the presentations.
Two interesting peaks on the 21st – the first was mainly Adam putting together the agreed UI elements and repeatedly pushing it up for all to see. The second peak was me trying (and generally failing) to master the Facebook API, as it needed domains working etc and so had to be pushed to a live server to test (until I found a workaround which I really should document).
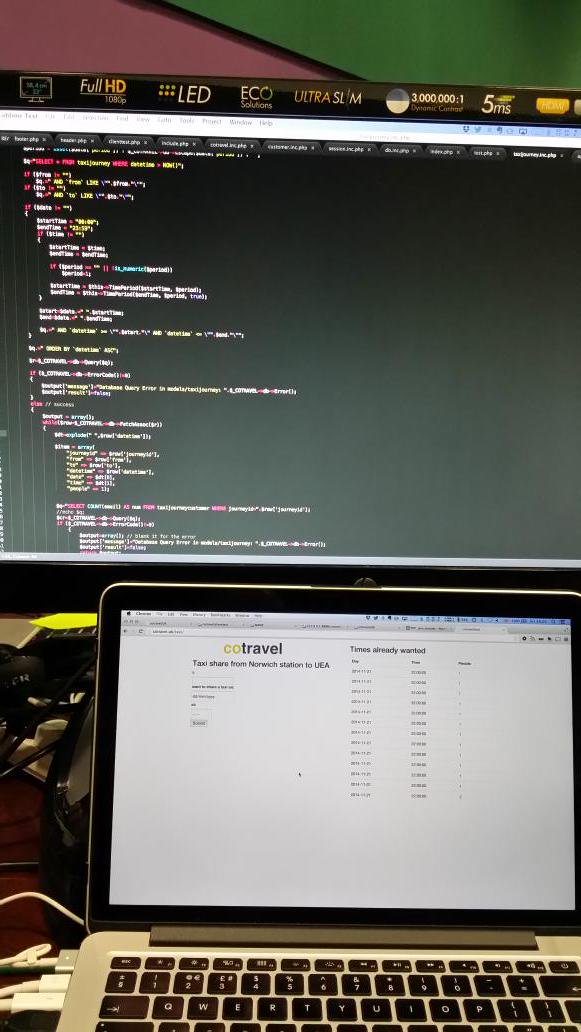
Of course once we went live…
We then had all manner of other stats available to us, for example a log of visitors to the site and the number of API calls made from our snazzy web 2.0 front-end to my dodgy interfaces. We went live at 14:00 and kept track every hour until 20:00.
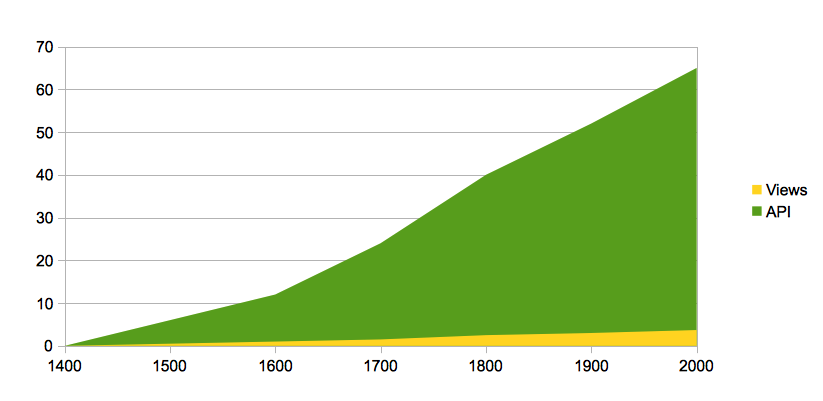
Here’s the graph showing (in 1000’s) the page views and (much higher) volume of API calls made to the system from 1400-2000 when we finally collapsed.
Overall Sync the City was a great experience, a lot of fun and a great way to meet interesting people and do ninja coding (plenty of opportunities to DevOps the **** out of it, or as we used to call it; make live changes to the code while users are still interacting).
Good luck to anyone taking part this year!